Two weeks ago, I roasted the federal government’s solution to 24/7 renewable energy: buy renewable energy locally. That can work to some degree for locating new-build data centers, which are significant loads on the grid. Most other sectors and subsectors need access to ports, rail, supply chains, and people – i.e., cities and military bases. For the most part, they are not geographically positioned with local access to significant renewable energy generation and, therefore, need electron superhighways known as transmission lines to receive bulk power sources hundreds of miles away and in different time zones in many cases.
Pole and Wire Needs
How many miles of power lines are needed for the energy transition? Two weeks ago, via a Wall Street Journal news clipping, I learned the International Energy Agency provided the answer: 80 million kilometers or 50 million miles by 2040. They did not specify between more expensive transmission lines, at $2 million per mile on the low end, and less costly distribution lines, at $200,000 per mile on the low end. Therefore, the cost is somewhere between $10 trillion and $100 trillion. Those are staggering numbers.
More staggering numbers: the DOE’s recent transmission needs study indicated we need 43,000 miles of added transmission lines in the United States by 2040 ($86 billion). In 2021 and 2022, a total of 2000 miles of transmission lines were completed, and therefore, it will be close to 2070 by the time 43,000 miles of new transmission are added, not counting the distribution upgrades.
We need more lanes of attack.
Electricity Supply & Demand Curves
Moving back to local action, customers need incentives (not to be confused with rebates or handouts) to manage their energy costs. We do not have this today because our electric rates are designed for a dumb grid from the analog era, as described last week.
The following supply and demand curves reflect a typical flat rate for electricity. The price is always the same; therefore, there is no motive to use more when prices are low or less when prices are high. This is a perfectly inelastic market. The change in consumption with the change in market price is zero because of the flat retail rate.
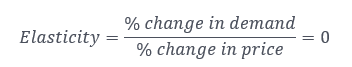 Er, I guess by the elasticity definition, the price change with demand is also zero. As I recall, zero divided by zero is indeterminate. No wonder my head explodes when I think about these things.
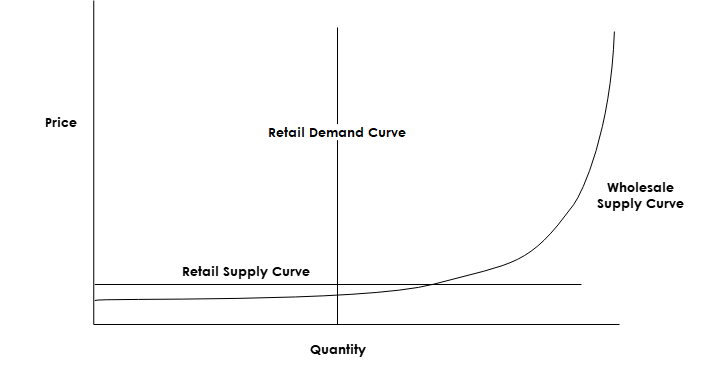 This results in higher average prices because customers see no need or motive to reduce when system peaks are experienced, and the wholesale price is higher than the retail price on the far right end of the curve. Utilities, in these cases, have revenue requirements, and they will recover those high wholesale costs eventually. Energy purchases during peak grid stress and high prices are blended into the average.
Dynamic Rate Influence
With dynamic rates, which means passing wholesale prices through to customers, we could see some load shifting from the orange zone to the green zone when prices are lower (see below). Note there is no time element involved with this chart.
 Introducing time and using last week’s MISO prices from a peak day in August this year, the load shift may look like the following.
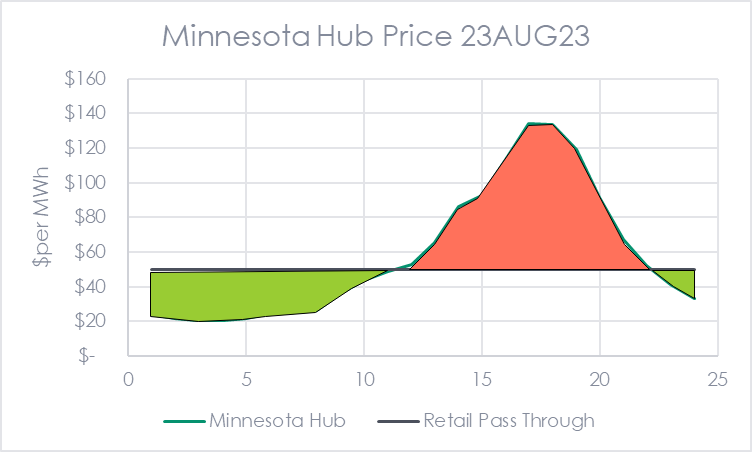 To some extent, these fictional cases would become reality if wholesale prices were passed through on retail rates.
Injecting Elasticity Into Demand Curves
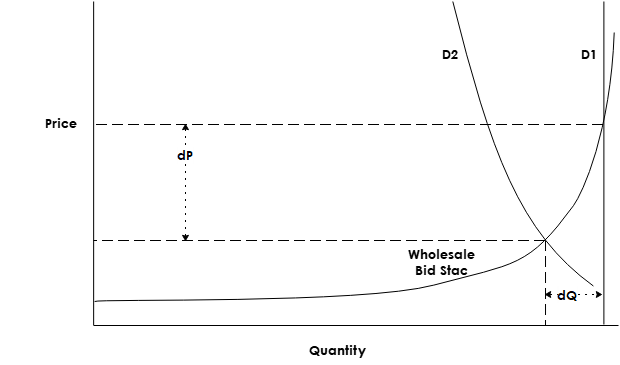
Another way to get there is to allow large energy users to bid flex loads into the market to provide elasticity in the demand curve. That would look like the following [1]. Demand curve D1 represents the conventional flat rate, whereas D2 allows customers to bid flex loads, resulting in price-responsive demand and lower demand, prices, and carbon emissions.
 Where:
D1 = demand curve with static rates and twelve-hour demand windows
D2 = demand curve with incentives to flex load to less-expensive, lower demand periods
dP = change in price for all customers on the grid
dQ = demand reduction through load flex
Short on Policy
So why don’t we switch to a model like this? Because there is no motive or force to change. Even where there are time-of-use rates in some places, the price differential is so small that it doesn’t result in elastic demand. There are not enough dollars of incentive to shift electricity use from peak time to off-peak to be worth the behavior change. E.g., I’m not going to bother waiting until 9:00 PM or the weekend to do the laundry, and I won’t be a smidge warm for a couple of hours until the peak rate period is over.
The other problem I see is that the peak windows are too long. I might need to forego air conditioning for 12 hours to save maybe 25 cents per day? No thanks. When customers can’t bridge these long gaps with decreased load, it mimics a flat rate. We use what we use because the alternative is too inconvenient, uncomfortable, negative on the bottom line, or all of the above. We need shorter periods of large price differentials, as demonstrated by the price/time curve from MISO above.
Head-Scratching Pricing Units
If you enjoy confusion, look into capacity auctions, the cost of new entry (used to set demand response incentives), and demand response incentives. Capacity auctions are bid in dollars per MW-day. The cost of new entry, typically the generator type with the lowest cost per kW, a combustion turbine, is priced in dollars per MW-yr. Incentives for demand response programs are priced in dollars per kW-yr. If that isn’t enough, these day and year units have nothing to do with energy, like a kW-hr. No. They represent the payments required on debt and equity, i.e., the weighted cost of capital, to finance the asset for the period noted. I.e., one year.  The money should be flowing into my mailbox at any time now because that just saved readers hours of pain.
[1] Peak Load Management Alliance.
The post Load Flexibility vs Indeterminate Supply and Demand appeared first on Michaels Energy.


